
Stop Wasting Broadcast Budget With Our Practical Guide to Infomercial Media Buying
Make Every Infomercial Airtime Buy Work Harder
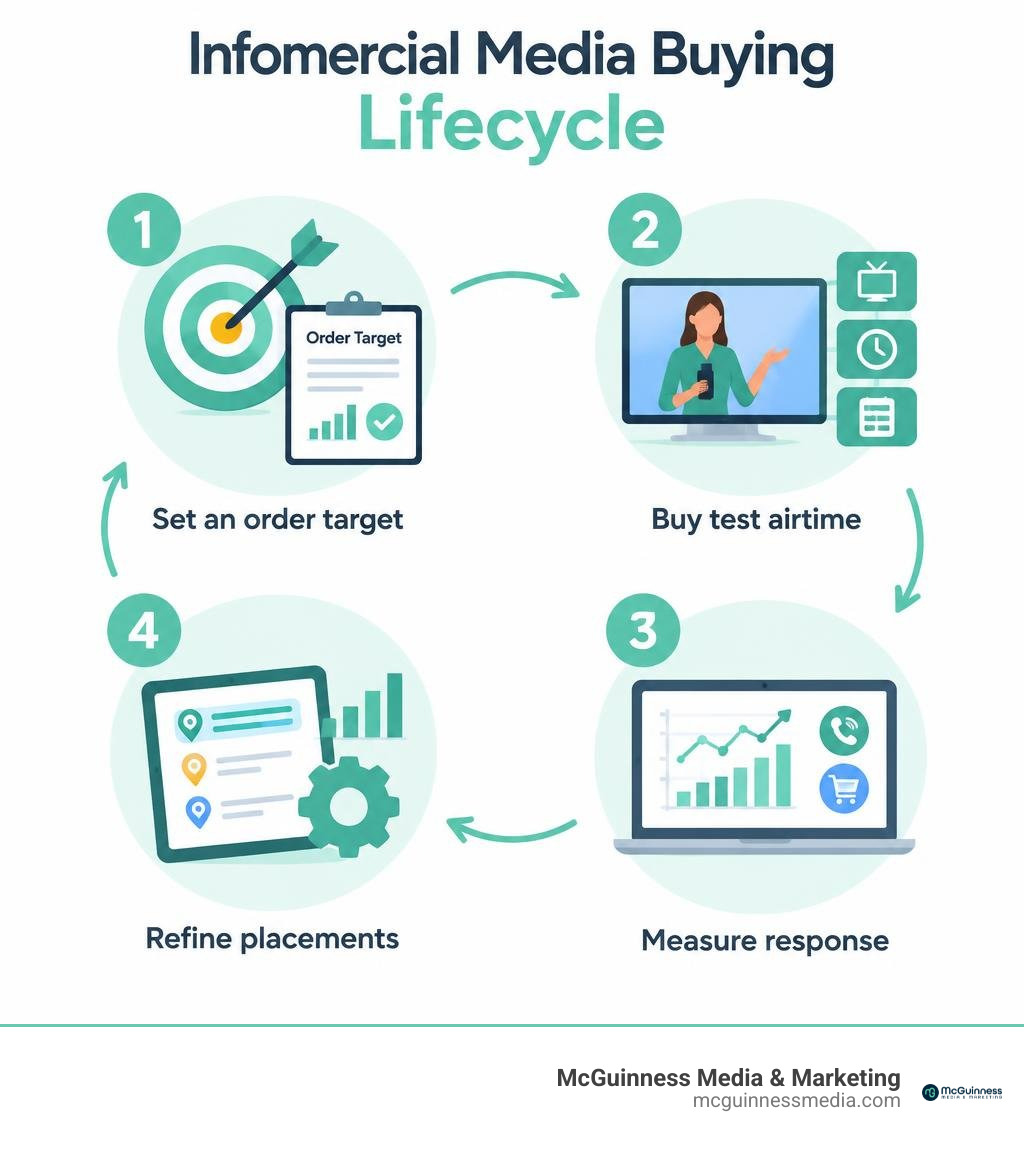
Infomercial media buying means choosing and purchasing airtime for ads built to drive a direct response, then judging each placement by the orders it produces. Start with a cost-per-order target your margins can support. Test a small mix of channels and time slots, track calls and online orders after each airing, and shift spending toward placements that deliver both affordable orders and enough sales volume to matter.
That takes more than finding cheap airtime. Your offer, creative, placement, and response data need to work together. This guide shows you how to plan a test, read the results, and decide where to spend next.
I’m Megan McGuinness, owner and chief marketing officer of McGuinness Media & Marketing. I bring more than 20 years of marketing strategy experience and a background in media planning and buying to this guide to infomercial media buying.
Related content about infomercial media buying:
What Sets Infomercial Media Buying Apart from Traditional TV Advertising?
Direct-response television (DRTV) operates on fundamentally different economic principles than general brand advertising. Traditional media planners buy commercial space based on gross rating points (GRPs), target demographic reach, and cost per thousand impressions (CPM). In contrast, direct-response buying treats television airtime as a direct sales pipeline, where every dollar spent must generate an accountable, profitable return in product sales or qualified leads.
The modern infomercial landscape traces its roots to 1984, when the Federal Communications Commission (FCC) lifted long-standing limits on the number of commercial minutes stations could air per hour. This regulatory change paved the way for 30-minute paid programming blocks, allowing brands to demonstrate products thoroughly and drive immediate phone and web purchases. By 1994, an estimated 91% of all broadcast television stations had aired or were actively airing infomercials. Today, direct-response television represents an industry powerhouse worth over $200 billion.
Rather than paying premium rates to secure fixed commercial pods during prime-time sitcoms or live sports, direct-response advertisers often work with agencies to turn remnant broadcast airtime into direct response profit. By acquiring unsold, discounted commercial inventory across regional broadcast affiliates, national cable networks, and digital feeds, media buyers secure massive audience exposure at a fraction of standard published rate cards.
| Dimension | Long-Form Infomercial | Short-Form DRTV | Traditional Brand Commercial |
|---|---|---|---|
| Standard Format Length | 28 minutes, 30 seconds (full show block) | 60 or 120 seconds | 15 or 30 seconds |
| Primary Campaign Objective | Immediate product sale or high-ticket lead | Immediate direct purchase or inquiry | Brand awareness and positive brand recall |
| Primary Evaluation Metric | Cost Per Order (CPO) and MER | Cost Per Order (CPO) and CPA | CPM, GRPs, Reach, and Frequency |
| Primary Inventory Used | Overnight, early morning, weekend daytime | Remnant rotators, daytime, fringe slots | Fixed prime-time, sports, and scatter pods |
| Product Price Sweet Spot | $50 to $300+ (or multi-pay continuity) | $19.99 to $49.99 (impulse purchase) | Any retail price point |
Orders Over Nielsen Ratings: Evaluating Direct Audience Action
One of the most surprising truths for brand marketers entering the direct-response space is that traditional television viewership ratings have virtually no correlation with the volume of orders a specific broadcast generates. High Nielsen ratings indicate how many televisions are tuned into a program, but they tell you nothing about viewer attentiveness, purchasing intent, or physical proximity to a payment method.
Historical analysis on infomercial audience responsiveness reveals that viewers of direct-response programs cannot be categorized purely by standard age and gender demographics. Instead, responsiveness depends on viewer engagement during specific dayparts and psychological receptivity to problem-solving messaging. A niche cable network airing an infomercial at 2:00 a.m. with an unmeasured Nielsen rating can easily outperform a highly-rated syndicated afternoon talk show if the late-night audience is attentive, engaged, and receptive to the offer.
Media buyers monitor real-time response mechanisms such as:
- Dedicated toll-free phone numbers assigned dynamically to individual stations and broadcast times.
- Unique vanity URLs and campaign-specific landing pages.
- Time-stamped server analytics that correlate immediate web traffic surges with exact broadcast airtimes.
- Custom promotional discount codes spoken during the call-to-action segments.
Short-Form DRTV vs. Long-Form Paid Programming
Direct-response television divides into two distinct creative and media formats: long-form infomercials and short-form DRTV spots.
Long-form paid programming runs for a standard broadcast duration of 28 minutes and 30 seconds (allowing 90 seconds for local station station-identification and commercial breaks). This format provides the storytelling runway required to agitate complex consumer problems, demonstrate multi-step solutions, showcase extensive third-party expert endorsements, present genuine customer testimonials, and build an irresistible value stack. Long-form is particularly effective for products priced above $50, fitness regimens, complex home improvement equipment, and health supplements that require consumer education.
Short-form DRTV utilizes standard 60-second or 120-second commercial lengths. These spots rely on rapid-fire visual hooks, fast problem-solution demonstrations, clear pricing, and immediate calls-to-action. Short-form is ideal for impulse-friendly products priced under $40 (such as kitchen gadgets and auto accessories) and for lead generation campaigns in insurance, legal services, or financial consulting.
Core Economics and Key Performance Metrics for Direct-Response TV
Media planning for direct response requires rigorous mathematical modeling. Before committing spend to broadcast networks, our team builds financial pro-formas that determine the maximum acquisition cost a campaign can absorb while remaining profitable.
High-end, professionally produced long-form infomercials typically carry production budgets ranging from $150,000 to $500,000. These productions incorporate studio filming, field demonstrations, testimonial shoots, motion graphics, and regulatory legal clearances. Because upfront production investments are substantial, direct-response campaigns depend on disciplined media buying analytics to ensure continuous return on capital.

A solid grasp of financial fundamentals separates winning campaigns from expensive mistakes, as outlined in our practical guide on media buying analytics.
Calculating Cost Per Order (CPO) and Allowable CPO
The fundamental benchmark in direct-response television is Cost Per Order (CPO), which tracks the exact media spend required to generate a single product purchase:
- Cost Per Order = Total Media Cost / Total Completed Orders
To determine whether an airing is profitable, media buyers calculate the Allowable CPO (also referred to as Break-Even CPO). This represents the maximum allowable media expenditure per sale after accounting for every operational, production, and distribution expense.
- Allowable CPO = Retail Selling Price – Cost of Goods Sold – Fulfillment and Shipping Expense – Payment Processing Fees – Per-Order Telemarketing Costs
If a health supplement sells for $80, costs $12 to manufacture, requires $8 for pick, pack, and parcel shipping, and incurs $4 in customer service and merchant fees, the transaction margin is $56. In this scenario, the Allowable CPO is $56. Any media placement that generates sales at a CPO below $56 produces an immediate front-end profit. Placements resulting in a CPO above $56 lose money on the initial broadcast unless backend continuity subscriptions or repeat purchases offset the front-end deficit.
Media Efficiency Ratio (MER) and Retail Sales Lift
Direct-response advertisers track top-line performance using the Media Efficiency Ratio (MER). MER functions as the broadcast equivalent of Return on Ad Spend (ROAS):
- Media Efficiency Ratio = Total Generated Gross Revenue / Total Media Expenditure
A campaign spending $10,000 on regional cable placements that generates $30,000 in gross direct sales achieves an MER of 3.0. In the direct-response industry, an MER of 2.0 is generally considered the minimum operational threshold to justify rolling out a media buy beyond the initial testing phase. Highly profitable campaigns frequently sustain MER benchmarks between 3.0 and 5.0.
Furthermore, broadcast television generates a powerful omnichannel halo effect. Industry data shows that retail sales for products actively supported by infomercial campaigns typically increase by 3x to 5x in brick-and-mortar stores across designated market areas (DMAs) where the television campaigns air. When evaluating media buys, experienced marketers factor this blended retail velocity and ecommerce uplift into their total campaign efficiency equations.
Advanced Media Buying Strategies: Buyouts, Dayparts, and Inventory Selection
Securing profitable broadcast inventory requires a blend of deep historical data, strong network relationships, and tactical flexibility. Professional media buyers do not simply purchase off-the-shelf rate cards; they negotiate structure, placement priority, preemptibility status, and volume discounts across broadcast stations and cable syndicates.
To maximize capital efficiency across campaigns, brands often leverage full-service media buying services to navigate network negotiations and secure favorable positioning.
| Broadcast Daypart | Standard Time Window | Relative Airtime Cost | Primary Demographic Profile | Typical Response Dynamics |
|---|---|---|---|---|
| Overnight | 1:00 a.m. to 6:00 a.m. | Low ($500 to $1,500/half-hr regional) | Shift workers, insomniacs, night owls | High conversion intent; distraction-free viewing |
| Early Morning | 6:00 a.m. to 9:00 a.m. | Moderate ($1,500 to $4,000/half-hr) | Early risers, retirees, active commuters | Steady call-in volume; high average order value |
| Daytime | 9:00 a.m. to 4:00 p.m. | Moderate to High ($2,000 to $6,000) | Homemakers, remote workers, retirees | Strong responsiveness for home and health categories |
| Early Fringe / Access | 4:00 p.m. to 7:00 p.m. | High ($4,000 to $9,000) | Broad multi-generational households | High reach; requires aggressive call-to-action |
| Late Night | 11:30 p.m. to 1:00 a.m. | Moderate to High ($3,000 to $8,000) | Adults 25-54 unwinding from work | Excellent responsiveness for fitness and lifestyle |
Strategic Inventory Acquisition: The Power of the Buyout Model
In direct-response media buying, inventory acquisition models fall into two primary structures: standard weekly spot placements and upfront bulk buyouts.
In the buyout model, an agency or advertiser purchases entire blocks of broadcast time across networks weeks or months in advance, locking in inventory outright. Research on broadcast slot buyout strategies underscores several distinct advantages of this approach:
- Guaranteed Placement Stability: Standard remnant direct-response ads are preemptible, meaning stations can bump your spot if a general market advertiser pays full rate. Buyouts lock down exact time slots without threat of preemption.
- Aggressive Pricing Power: Committing to guaranteed inventory blocks enables buyers to negotiate steep volume discounts, lowering the baseline cost per broadcast minute.
- Advanced Operational Planning: Bulk inventory ownership allows media planners to map campaign schedules well into the following month, ensuring predictable call center staffing and inventory fulfillment schedules.
Typical Airtime Costs by Channel and Broadcast Daypart
Infomercial airtime pricing fluctuates based on station coverage, household reach, and time of day.
- A 30-minute overnight slot on a regional cable network or independent local broadcast affiliate can cost as little as $500.
- A high-performing 30-minute national cable placement during peak response hours (historically 2:00 a.m. to 4:00 a.m., when channel surfers provide an attentive, undivided audience) typically ranges from $3,000 to $15,000 per airing.
- As early as 2009, market data indicated that most infomercial spending in the United States had shifted outside traditional overnight slots into daytime and early morning blocks, proving that daytime viewers respond reliably when the creative demonstrates undeniable value.
The Continuous Optimization Cycle: Testing, Data Analysis, and Scaling
Launching a direct-response television campaign is not a set-it-and-forget-it endeavor. It is an iterative, data-driven discipline centered on systematic media testing and rigorous performance evaluation, as detailed in our guide to crafting a winning media buying strategy.
Applying the PDCA Framework in Infomercial Media Buying
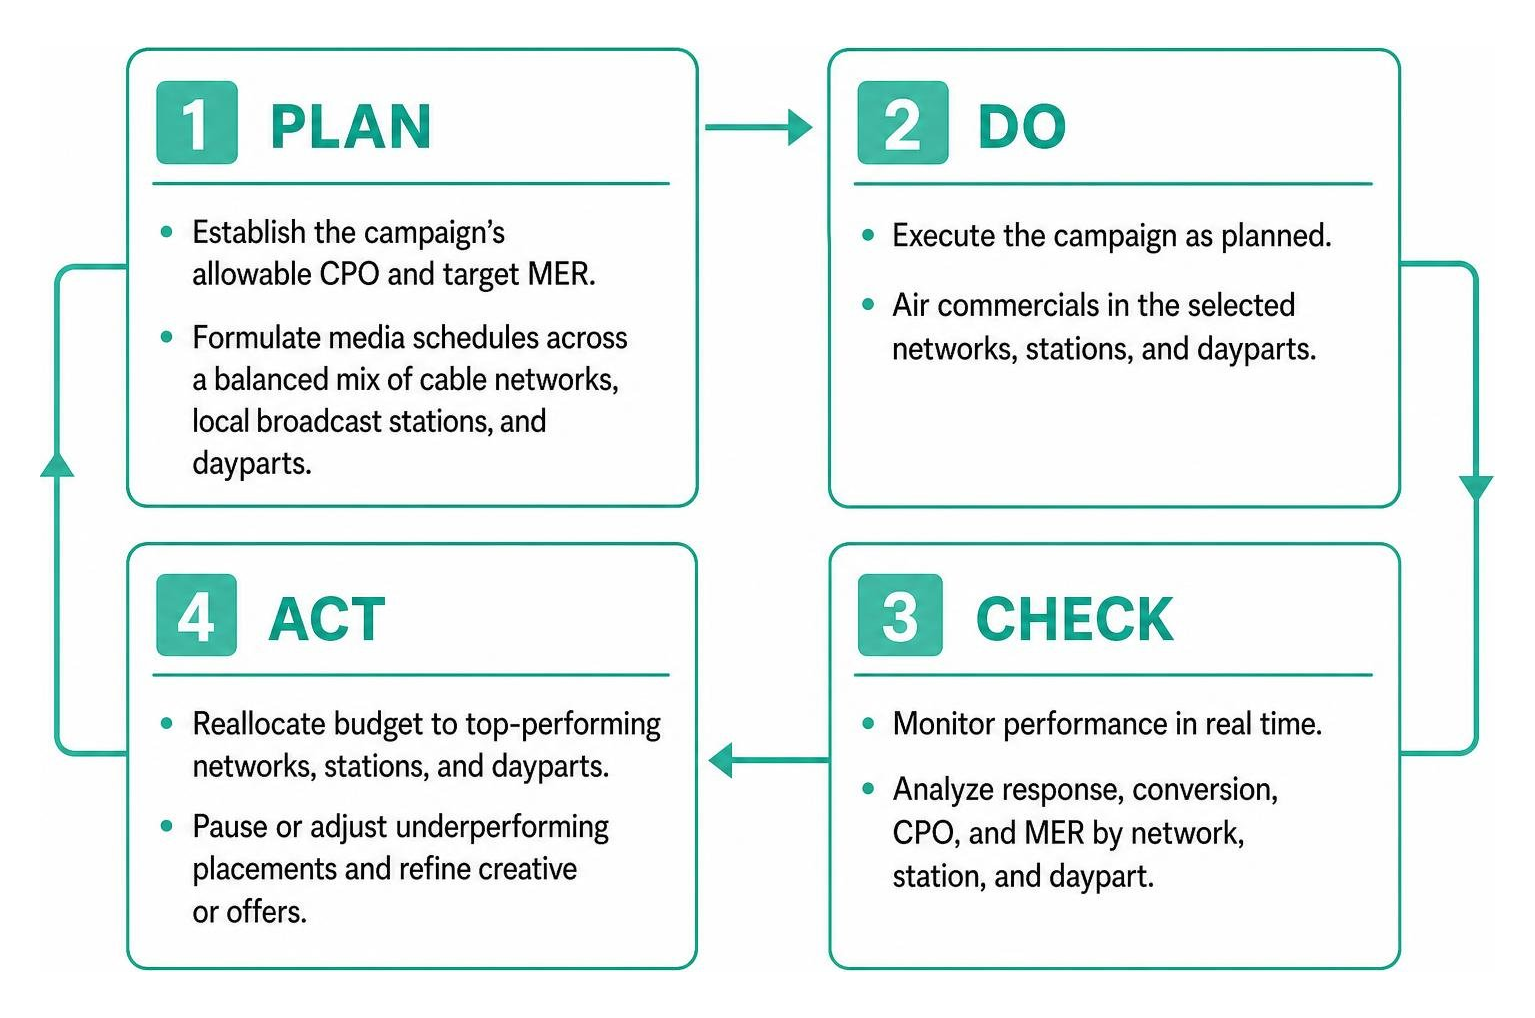
Direct-response campaign management follows the continuous Plan-Do-Check-Act (PDCA) framework:
- Plan: Establish the campaign’s allowable CPO and target MER. Formulate media schedules across a balanced mix of cable networks, local broadcast stations, and dayparts.
- Do: Execute initial pilot airings across designated test stations over a two-to-four-week flight.
- Check: Aggregate response data from toll-free numbers, web sessions, and vanity URLs within 24 to 48 hours of each broadcast. Calculate exact CPO and MER by network, day of week, and specific time slot.
- Act: Cancel unprofitable stations, renegotiate rates on marginal placements, and reallocate capital into high-performing networks and dayparts.
Balancing Efficiency vs. Volume and Avoiding Critical Data Pitfalls
When optimizing direct-response campaigns, media buyers must navigate complex data nuances to avoid common analytical pitfalls:
- The Micro-View Trap: Evaluating time slots purely on short-term data can distort campaign planning. For example, for a product with an allowable CPO KPI of $70 (equivalent to approximately 10,000 yen in international direct-response campaign modeling), analyzing a single month’s isolated performance can uncover a high-performing “better frame” that might appear unprofitable when blurred into a six-month cumulative average. Buyers must review both granular weekly trends and macro cumulative data before cutting inventory.
- Price-Adjusted Buying Distortions: Artificially adjusting target unit costs down to force an underperforming slot into compliance can damage network relationships and lead to inaccurate media valuations. If a slot consistently fails to produce orders, buyers should eliminate it rather than trying to force discounts on dead airtime.
- Balancing CPO Against Total Order Volume: A late-night weekend slot on a micro-cable network might deliver an exceptional CPO of $15, but only produce 4 orders per week. Conversely, a national morning slot might generate a $45 CPO (still well below your $56 allowable limit) while delivering 400 orders per week. True commercial success requires balancing cost efficiency with the total order volume needed to move inventory and scale a business.
Modernizing the Strategy: Connected TV and Omnichannel Digital Integration
Direct-response television is no longer confined to traditional linear broadcast and cable networks. Modern campaigns treat television as the primary top-of-funnel engine within a broader digital ecosystem, as explored in our guide to scaling ecommerce brands through modern DTC media buying.
Successful omnichannel integration tactics include:
- Deploying on-screen QR codes alongside toll-free numbers to allow mobile-first viewers to complete orders within seconds.
- Running coordinated paid search and social retargeting ads matched to the precise broadcast schedule of regional television airings.
- Utilizing automated SMS capture on landing pages to convert secondary television web traffic into recurring subscribers.
- Tracking cross-device digital conversions using IP-matched multi-touch attribution models.
Adapting Infomercial Media Buying for CTV and OTT Streaming
Connected TV (CTV) and Free Ad-Supported Streaming TV (FAST) platforms such as Pluto TV, Tubi, and Roku Channel have embraced direct-response advertising. Viewers on these platforms are accustomed to ad-supported entertainment, creating fertile ground for DRTV formats.
Connected TV media buying blends the emotional storytelling of long-form television with the granular audience targeting of digital marketing. Media buyers can target households based on purchase intent, credit card spending habits, and specific in-market behaviors, serving interactive, shoppable video units directly to living room screens.
AI-Driven Personalization and Dynamic Video Creative Management
Advancements in artificial intelligence and dynamic video production allow direct-response brands to tailor their messaging at scale. Rather than relying on a single static creative cut for an entire broadcast season, media teams now deploy multiple creative variations tailored to audience segments.
AI-driven video editing tools help creative teams rapidly generate seasonal hooks, test varied problem statements, and produce platform-specific aspect ratios. Learn how to effectively manage your ad creatives for maximum ROI to prevent audience creative fatigue and sustain profitable campaigns over time.
Frequently Asked Questions About Direct-Response Media Buying
What is the minimum budget required to test an infomercial campaign?
A statistically valid initial television media test typically requires an airtime budget between $25,000 and $50,000, deployed over a three-to-four-week testing flight. This budget allows media planners to test multiple cable networks, regional broadcast markets, and dayparts with enough airing frequency to determine true baseline conversion rates and calculate accurate Allowable CPO metrics.
How quickly can an advertiser see direct response results after an airing?
Direct-response television delivers nearly instantaneous feedback. Telemarketing call centers experience traffic spikes within 30 to 90 seconds of the on-screen call-to-action, and ecommerce analytics capture real-time surges in direct website visits and checkout conversions during and immediately following the broadcast window. Comprehensive 24-hour reporting allows buyers to evaluate slot performance on a daily basis.
Why do infomercials continue to generate high returns during economic downturns?
Direct-response television historically thrives during economic downturns for two key reasons:
- Discounted Airtime Costs: When traditional brand advertisers cut their marketing budgets during recessions, television networks face excess unsold commercial inventory, driving remnant and direct-response airtime rates down significantly.
- Clear Value-Driven Consumer Messaging: Infomercials focus heavily on everyday problem-solving, product durability, money-saving utility, and added-value bundles, which resonate strongly with value-conscious consumers during tighter economic cycles.
Conclusion
Direct-response television remains one of the most powerful, accountable, and scalable marketing channels available. By abandoning vanity ratings in favor of strict Cost Per Order calculations, securing advantageous airtime pricing through strategic inventory acquisitions, and maintaining a disciplined testing framework, brands can build highly profitable sales engines that dominate both living rooms and digital storefronts.
At McGuinness Media & Marketing, we leverage decades of media planning expertise, deep broadcast relationships, and comprehensive creative capabilities to help businesses scale their advertising profitably. Explore our expert media planning services today to discover how our team can structure, negotiate, and execute direct-response broadcast campaigns that turn airtime into revenue.