
From Insights to Impact: Crafting Content That Performs with Data
Moving Beyond Guesswork in a Crowded Digital World
Data driven content is a strategic approach to creating, distributing, and optimizing content based on real insights from analytics, audience behavior, and performance metrics—rather than assumptions or intuition.
Key elements of data driven content:
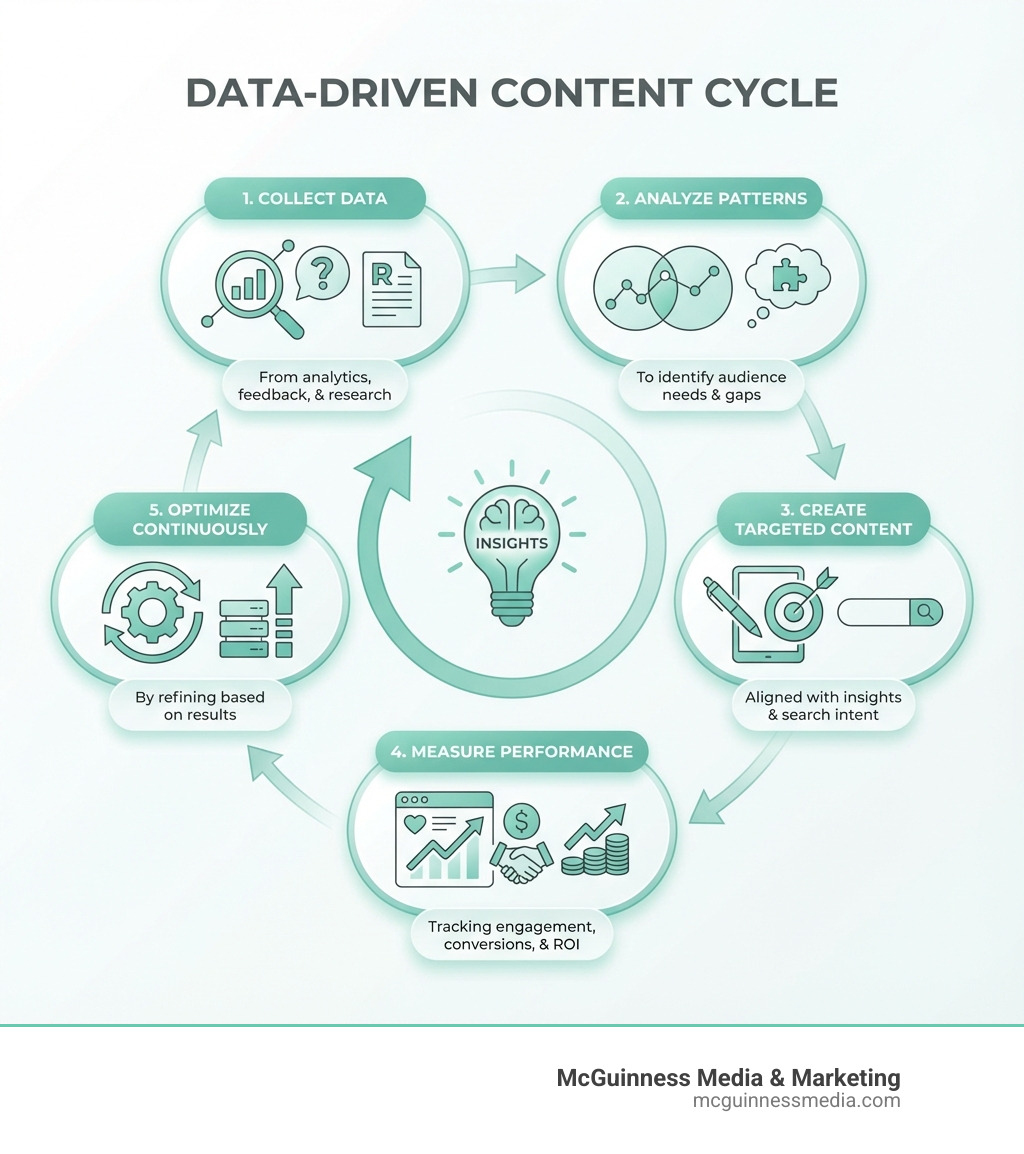
- Collect data from website analytics, customer feedback, social media, and CRM systems
- Analyze patterns to understand what your audience truly needs and responds to
- Create targeted content that addresses specific pain points and search intent
- Measure performance using metrics like conversion rates, engagement, and ROI
- Optimize continuously based on what the data reveals about content effectiveness
The digital landscape is drowning in content. Brands are creating 66% more content than they did just a few years ago, spending 52% more on content marketing. Yet nearly half of marketing teams don’t understand how their content is actually performing.
This disconnect creates a costly problem: businesses invest time and money into content that may never reach the right people or drive meaningful results. Without data guiding your decisions, you’re essentially throwing ideas at the wall and hoping something sticks.
Data driven content changes this entirely. Instead of guessing what your audience wants, you know what resonates. Instead of wondering which topics to cover, you have evidence pointing the way. Instead of creating content in the dark, you turn on the lights.
The shift from intuition-based content to evidence-based strategy isn’t just about better metrics—it’s about building authentic connections with your audience and achieving measurable business growth. When you understand what your customers are searching for, which content keeps them engaged, and what ultimately drives conversions, you stop wasting resources on content that doesn’t perform.
I’m Megan McGuinness, owner and chief marketing officer of McGuinness Media & Marketing, and I’ve spent over 20 years helping brands leverage data driven content strategies to cut through the noise and achieve real results. This guide will show you exactly how to transform your content from a cost center into a predictable growth engine for your business.
The Foundation: Gathering Data and Understanding Your Audience
Before we can craft compelling content, we need to understand who we’re talking to and what they care about. This is where data collection becomes our compass. Data driven content is all about using relevant data to inform every step of the content creation process. Instead of relying on assumptions, we leverage data analytics and engagement metrics to ensure our marketing efforts are aligned with real audience needs and behaviors. This means moving beyond guesswork to precision in content marketing.
How to Identify and Understand Your Target Audience
To truly connect with our audience, we must first know them intimately. What data is used for data driven content? It’s factual information generated from experiments, surveys, or testing that serves as a basis for forming conclusions. This data is collected from online customer information and conversations, helping us become “digitally human” and build genuine relationships.
How can businesses collect relevant data for content marketing? We start by casting a wide net, gathering insights from multiple sources:
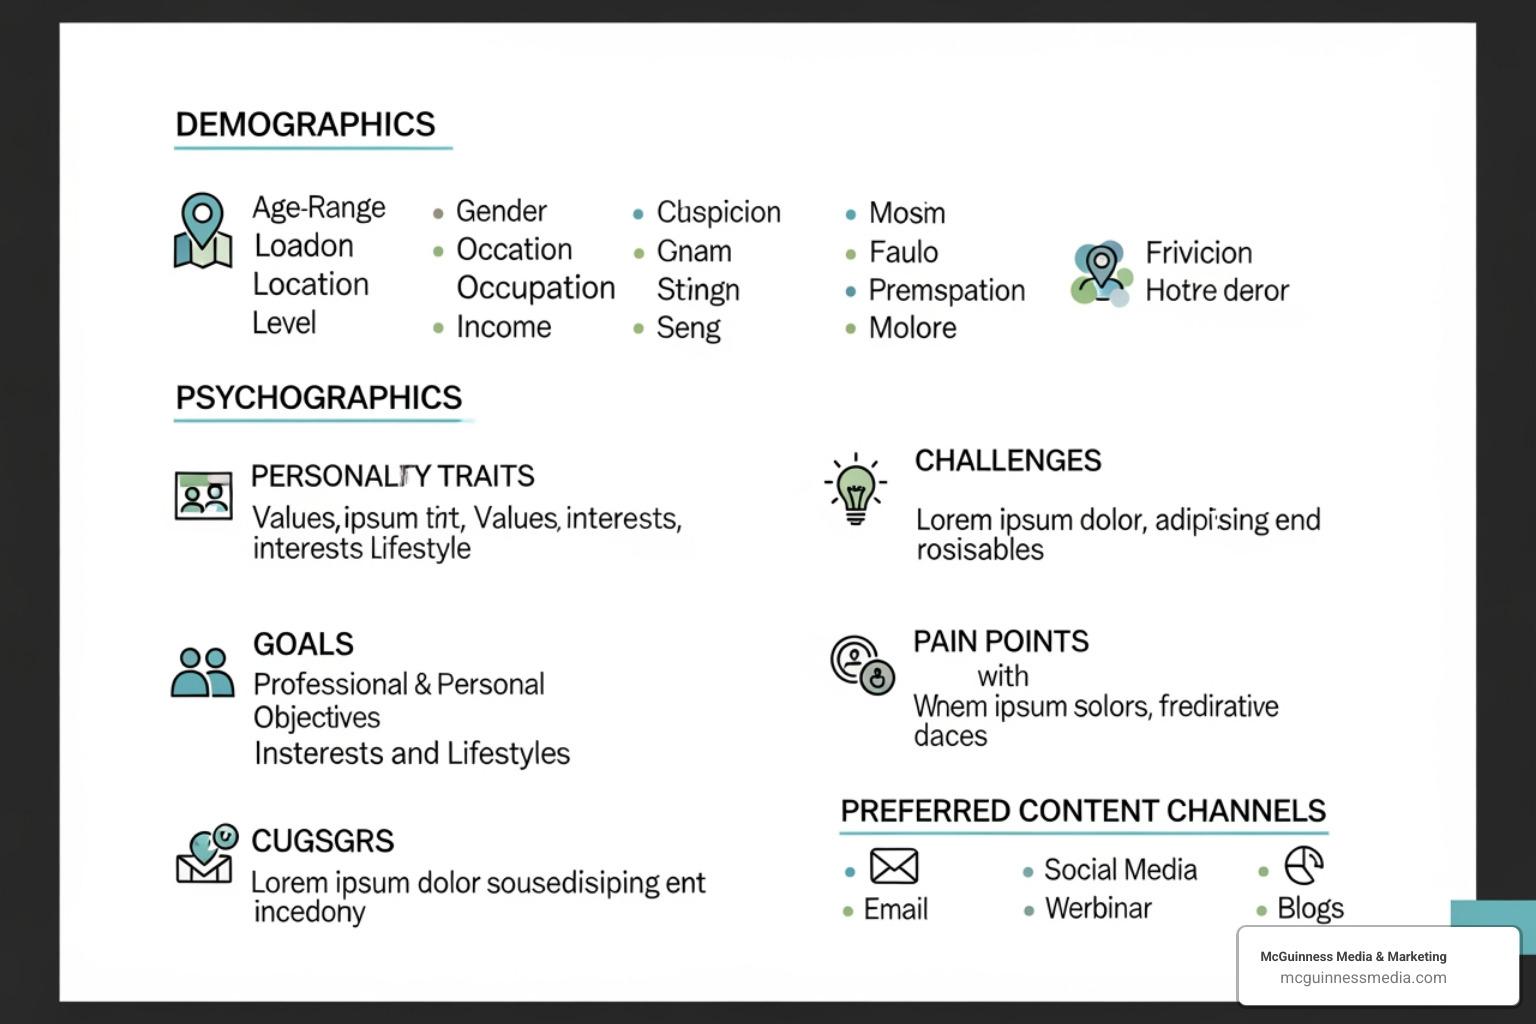
- Demographics and Psychographics: Basic demographics like age, location (like our audience here in Warwick, RI and across Rhode Island), and income are a starting point, but we need to go deeper. Psychographics reveal their interests, values, lifestyles, and even emotional triggers.
- Behavioral Data: This includes how they interact with our website, emails, and social media. What pages do they visit? How long do they stay? What do they click on? This gives us invaluable insights into audience behaviors.
- Customer Feedback: Surveys, customer interviews, and user-generated content provide direct insights into their needs and pain points. Listening to customer support logs and sales team feedback can also reveal common questions, objections, and how our products/services are actually used.
- Website Analytics (Google Analytics): This tool provides a wealth of information on audience demographics, website metrics (sessions, unique sessions, duration, pages per session, bounce rate, page views, acquisitions, conversions), and helps us understand customer search behavior and website interaction.
- CRM Data: Our Customer Relationship Management (CRM) system holds crucial customer information, lead sources, and product sign-ups, offering a broader view of customer preferences.
- Social Media Listening: Monitoring conversations in LinkedIn groups, Reddit threads, niche forums, and competitor comment sections helps us understand trending topics and what our audience is discussing.
By combining first-party data (gathered directly from our customers) with third-party data (market research, industry trends), we can build detailed audience profiles or buyer personas. These personas are created by conducting experiments, surveys, and case/research studies, helping us understand our target audience’s interests, beliefs, niches, and buying cycles. An intimate understanding of our audience gives us an unparalleled edge because we understand their pain points and what keeps them awake at night.
Best Practices for Audience Segmentation and Ethical Data Use
Once we have a rich mix of data, how do we segment audiences for better engagement? Segmentation allows us to tailor content to specific groups, making it far more relevant and effective.
- Behavioral Segmentation: Grouping audiences based on their actions (e.g., recent purchasers, frequent website visitors, cart abandoners). This allows for dynamic content and personalized recommendations.
- Demographic Segmentation: While basic, it’s still useful for broad targeting (e.g., content for small business owners in Providence vs. those in Newport).
- Geographic Segmentation: Particularly relevant for local businesses in Rhode Island, this helps us tailor content to specific regional needs or events.
However, the power of data comes with a significant responsibility: ethical usage and compliance. Data privacy concerns are pervasive, making ethical data collection a business imperative. Companies must prioritize transparency in how they gather and use customer data, clearly communicating data policies to their audience. Compliance with GDPR, CCPA, and other regulations is not just a legal requirement but a way to maintain trust. We ensure our data practices in Warwick, RI, and beyond, are always transparent and compliant.
Building trust means being clear about why we collect data, how we use it, and what benefits it brings to our audience. This ethical framework ensures our data driven content strategies foster genuine connection, not just conversions.
From Data to Direction: Crafting Your Content Strategy
With a deep understanding of our audience and a wealth of data at our fingertips, we’re ready to translate insights into a compelling content strategy. This is where we move from understanding to action, using data to inform content ideation and creation.
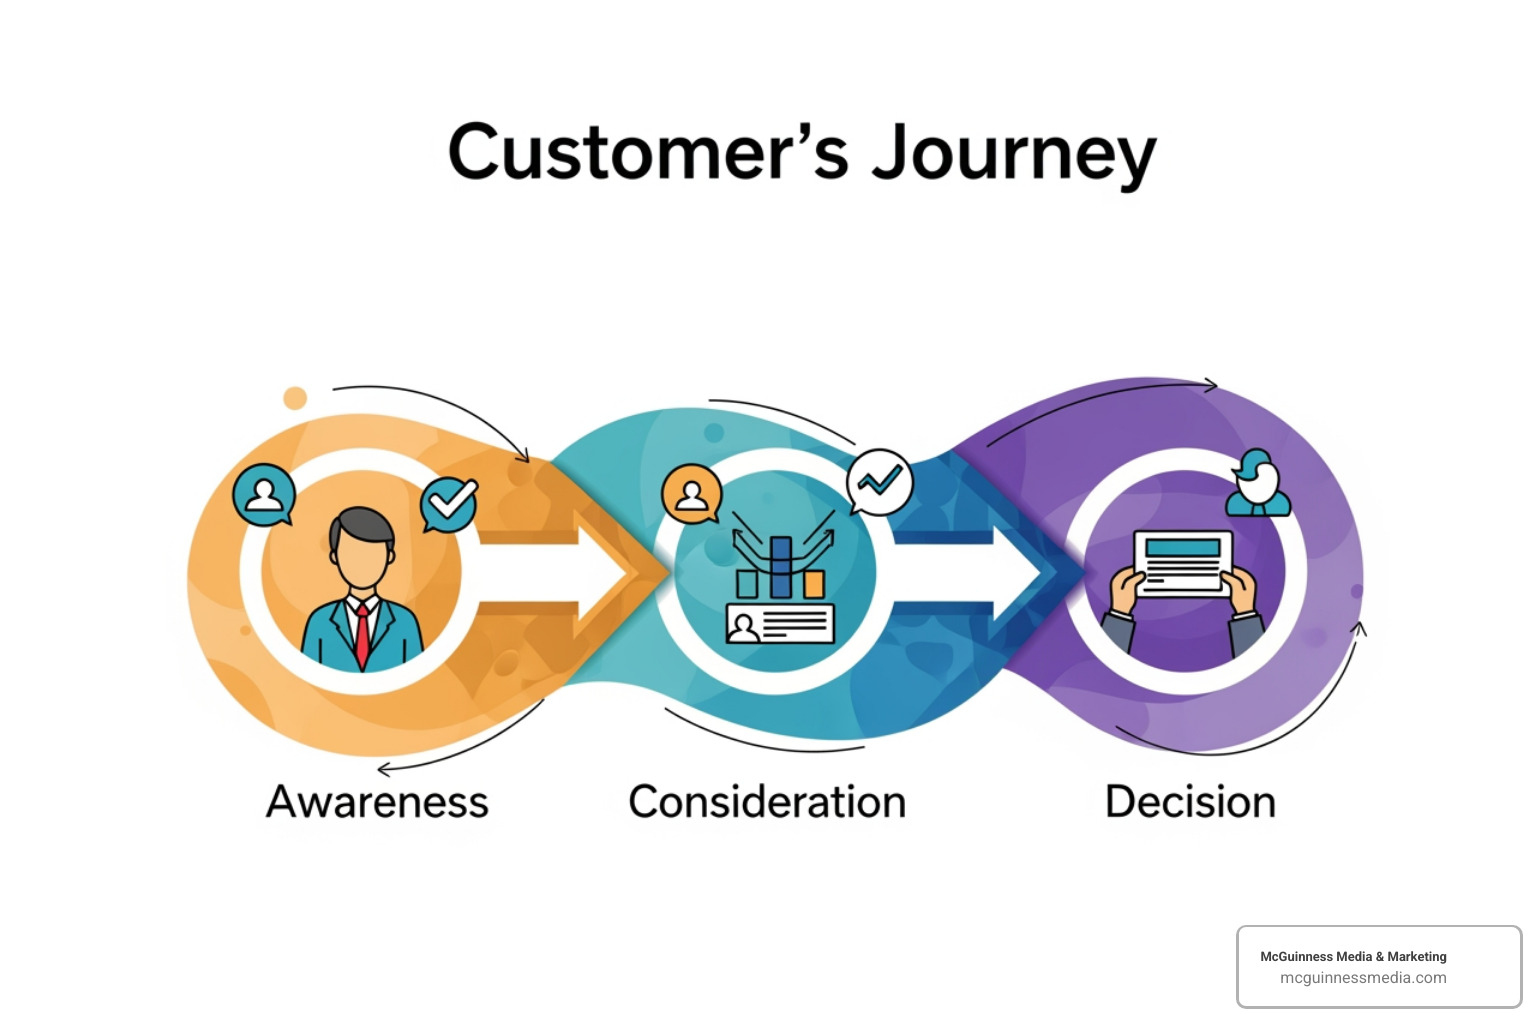
The average B2B buyer consults 13 pieces of content and information sources along a non-linear path to purchase. This highlights the need for a comprehensive content strategy that addresses every stage of the buyer journey. What are the key stages of the buyer journey, and how should content be custom for each?
- Awareness Stage (Top of the Funnel – ToFu): At this stage, potential customers are just realizing they have a problem or need. Our content should focus on education and problem identification. Examples include blog posts, infographics, social media posts, and short videos that address common pain points without being overtly promotional. For instance, a blog article appearing in organic search results is a classic ToFu example.
- Consideration Stage (Middle of the Funnel – MoFu): Here, the audience is actively researching solutions. Our content should provide detailed information, comparisons, and demonstrate our expertise. This includes whitepapers, e-books, case studies, webinars, and detailed guides. Case studies and customer feedback resonate well at this stage.
- Decision Stage (Bottom of the Funnel – BoFu): The customer is ready to make a purchase. Content here should directly address why our solution is the best fit. This means testimonials, product demos, free trials, consultations, and detailed pricing guides.
Using Data to Inform Content Ideation and Creation
How can data be used to inform content ideation and creation? Data is our secret sauce, guiding us to topics that genuinely resonate.
- Search Trends and Keyword Research: Tools like Google Analytics and Google Search Console show us what people are actively searching for. We analyze search queries, impressions, clicks, and average position to identify high-potential keywords. We don’t just chase keywords; we understand the intent behind them. This helps us define a clear topic, angle, and slant for each piece of content. For example, if we see a surge in searches for “digital marketing strategies for small businesses in Rhode Island,” that’s a clear signal.
- Customer Support Logs & Sales Team Feedback: These internal resources are goldmines for understanding common questions and objections. If multiple customers are asking the same question, it’s a perfect topic for a blog post or FAQ.
- Social Listening Tools: By monitoring social media, we can identify trending conversations and gauge audience sentiment around specific topics. This helps us craft timely and relevant content.
- Competitor Analysis: What content are our competitors creating? What’s performing well for them, and where are their gaps? This helps us identify opportunities to create better, more comprehensive content.
- Content Audits: Reviewing our existing content data helps us identify top-performing pieces that can be updated or repurposed, and underperforming content that needs improvement or removal. This is a crucial step in ensuring our content stays relevant and effective.
We apply these insights at three stages: before creation (to determine type, audience, format), during creation (to shape narratives, give scale, demonstrate change or discrepancy), and after creation (to analyze performance and optimize). For example, demonstrating a striking change trend using data not only brings weight to a discussion but can also evoke an emotional response from readers. However, when showing correlation, we are always careful not to imply causation, making it clear that two things are connected but not necessarily that one directly leads to the other. There are 9 Great Ways to Use Data in Content Creation, and we aim to use them all.
Achieving Personalization and Repurposing Content Effectively
Personalization is no longer a luxury; it’s an expectation. How can personalization be achieved through data in content marketing?
- Dynamic Content: Using data from our CRM or website analytics, we can serve different website content to different users based on their past behavior, demographics, or stage in the buyer journey.
- Personalized Recommendations: If a user has viewed several blog posts on SEO, we can recommend related content or services based on that interest.
- Segmented Email Campaigns: Instead of sending generic newsletters, we segment our email lists based on interests or past interactions and send highly targeted content. For example, a business in Warwick, RI might send custom content about local SEO trends to businesses in Providence, RI.
Repurposing content effectively using data insights is also a smart strategy. Why create something entirely new when you have high-performing content that can reach a new audience in a different format?
- Blogs to Videos: A popular blog post can be transformed into a video script, reaching audiences who prefer visual content.
- Infographics from Case Studies: A detailed case study can be distilled into an eye-catching infographic for social media or presentations.
- Webinars into Blog Series: A successful webinar can be broken down into several blog posts or a downloadable e-book.
By adapting to the new media landscape, we ensure our valuable content reaches a broader audience and maintains its impact across various platforms. We ensure each piece of content delivers value, no matter its form.
Execution and Measurement: Activating and Optimizing Your Data-Driven Content
Even the best data driven content strategy won’t succeed without meticulous execution and continuous measurement. This phase is about bringing our content to life and ensuring it performs.
Content management plays a crucial role in a data-driven strategy. A robust Content Management System (CMS) allows us to centralize our content, manage workflows, and track performance efficiently. Without a centralized system, it’s easy for content efforts to become disjointed and difficult to analyze. We also rely on content calendars to ensure consistent publication, which is vital for maintaining relevance and site traffic. According to a HubSpot study, publishing 5-10 articles per month leads to a good ROI and consistent site traffic.
The Most Effective Methods for Testing and Optimizing Content
How can we ensure our content is always improving? The answer lies in relentless testing and optimization. What are the most effective methods for testing and optimizing content post-launch?
- A/B Testing: This involves creating two versions of a piece of content (e.g., two different headlines, CTA buttons, or images) and showing them to similar audience segments to see which performs better. A/B testing can increase click-through rates by as much as 49%. We A/B test everything from email subject lines to landing page layouts to call-to-action (CTA) variations.
- Multivariate Testing: A more complex form of A/B testing, this allows us to test multiple variables simultaneously to understand how different elements interact.
- Conversion Rate Optimization (CRO): This is the process of improving our website and content to increase the percentage of visitors who convert into customers. We analyze user behavior data (heatmaps, user session recordings) to identify friction points and optimize pages for better conversions.
- Content Refreshing: Data from tools like Google Analytics and Google Search Console can identify content that is losing traffic or becoming outdated. Updating existing content is crucial because information can become outdated, or audiences may demand new details. Improving underperforming content can boost rankings and conversions.
By continuously testing and refining our content, we adapt and evolve our content strategy based on performance data. This iterative process ensures we’re always maximizing ROI through our content.
Key Metrics for Measuring the Success of Data-Driven Content
What are the key metrics for measuring the success of data driven content marketing? And what are the essential KPIs for a data-driven content marketing dashboard? We believe in looking beyond vanity metrics to truly understand content impact. Here’s a list of essential KPIs we track:
- Traffic Sources: Where are our visitors coming from (organic search, social media, referral, direct)? This helps us understand which channels are most effective.
- Conversion Rate: The percentage of visitors who complete a desired action (e.g., fill out a form, make a purchase, download an asset). This directly measures our content’s effectiveness in driving business goals.
- Bounce Rate: The percentage of visitors who leave our site after viewing only one page. While a high bounce rate isn’t always bad (sometimes users find what they need quickly), it’s important to contextualize it with other engagement metrics. For blogs, the average bounce rate across sectors is 82.4%.
- Time on Page / Session Duration: How long are users spending with our content? Longer durations often indicate higher engagement.
- Engagement Rate: Likes, shares, comments, and other interactions on social media posts show how well our content resonates with the audience.
- Leads Generated: The number of new prospects acquired through our content.
- Customer Lifetime Value (CLV): The total revenue a customer is expected to generate over their relationship with our business. Content that attracts high-CLV customers is invaluable.
- Return on Investment (ROI): The ultimate measure of success, calculating how much revenue our content marketing efforts generate compared to their cost. This helps us justify further investment and demonstrates the direct business impact.
A helpful chart from the Content Marketing Institute outlines some of the best metrics to analyze the performance of different content types. By constantly monitoring these KPIs, we can make informed decisions, adjust our strategies, and ensure our content is always working towards our business objectives.
Advanced Levers: Scaling Your Strategy with AI, BI, and UGC
As we push the boundaries of data driven content, we look to advanced tools and strategies to gain even deeper insights and amplify our efforts. This includes leveraging Business Intelligence (BI), Artificial Intelligence (AI), and User-Generated Content (UGC).
How to Leverage Business Intelligence (BI) and AI for Deeper Insights
What are the differences between data analysis and Business Intelligence in marketing? Data analysis often focuses on examining past and present data to understand trends. Business Intelligence (BI), on the other hand, takes a broader view, encompassing data warehousing, data mining, and reporting through tools like BI marketing dashboards to provide a comprehensive, real-time view of business performance. BI helps us analyze traffic, metrics, conversions, and trends, and segment our audience based on shared characteristics.
How can BI tools be leveraged for content marketing efforts? BI dashboards allow us to visualize all our content performance data in one place, enabling improved decision-making, trend identification, and process streamlining.
How can AI and automation be used to gain deeper insights from marketing data? AI is rapidly reshaping marketing, enabling brands to anticipate user needs and deliver valuable content before customers even realize they want it.
- AI-driven Personalization: AI can analyze vast amounts of data to create hyper-personalized content recommendations and dynamic website experiences. A recent Forbes report highlights how AI-driven personalization is reshaping marketing, enabling brands to anticipate user needs and deliver valuable content.
- Automating Data Analysis: AI-powered tools can quickly sift through complex datasets, identify patterns, and surface actionable insights that might take humans days or weeks to uncover.
- Content Creation with AI Tools: While we believe human creativity is paramount, AI tools can assist with research, generate content outlines, and even draft initial versions of articles, freeing up our team to focus on strategic thinking and refinement. This helps us produce content more efficiently for our clients in Rhode Island.
- Predictive Content Recommendations: AI can predict which content pieces are most likely to resonate with specific audience segments, allowing us to proactively deliver relevant information.
The rise of AI in marketing means we can gain deeper insights from our data, automate repetitive tasks, and deliver more impactful content than ever before.
Leveraging User-Generated Content (UGC) in Your Strategy
How can user-generated content (UGC) be leveraged effectively in a data-driven strategy? UGC is an incredibly powerful tool for building trust and authenticity. It’s content created by our customers, for our customers, and it speaks volumes.
- Building Trust and Authenticity: Consumers are highly influenced by their peers. 93% of consumers employ UGC to decide whether to buy from a company, and 70% study user-generated reviews and ratings before making a purchase. In fact, 41% need at least seven+ pieces of UGC to place an order.
- Encouraging Customer Reviews and Testimonials: We actively encourage our clients’ customers to leave reviews and share their experiences. These authentic stories provide social proof and valuable insights.
- Running UGC Campaigns: Contests or campaigns that invite users to share their experiences with our products or services can generate a wealth of engaging content.
- Featuring Customer Photos and Testimonials: Showcasing real customers using and loving our products builds a powerful connection. We can use data to identify our most enthusiastic customers and feature their content.
Incorporating user-generated content works wonders. It builds brand recognition and trust as it’s provided by current customers who’ve used our products and services for real. It’s a testament to the fact that while data guides us, human connection and authentic experiences are what truly drive engagement.
Conclusion: Turn Your Content into a Growth Engine
We’ve journeyed through the intricate world of data driven content, from gathering foundational insights to leveraging advanced AI and BI tools. The message is clear: in today’s crowded digital landscape, relying on guesswork is a recipe for wasted resources and missed opportunities.
By embracing a data driven content strategy, we shift from a reactive approach to a proactive one. We stop producing content for its own sake and start crafting pieces that are carefully designed to meet audience needs, drive specific business objectives, and generate measurable ROI. This means a shift from quantity to quality, ensuring every piece of content published for our clients in Warwick, RI, and across Rhode Island, serves a clear purpose.
The key benefits are undeniable: more targeted content, higher conversion rates, smarter resource allocation, and continuous optimization. Data becomes our competitive advantage, allowing us to adapt and evolve our content strategy based on real-time performance.
At McGuinness Media & Marketing, we pride ourselves on helping brands harness this power. We transform content from a speculative expense into a predictable growth engine. Ready to open up the full potential of your content and achieve authentic audience connection? Explore our Digital Marketing services to get started.